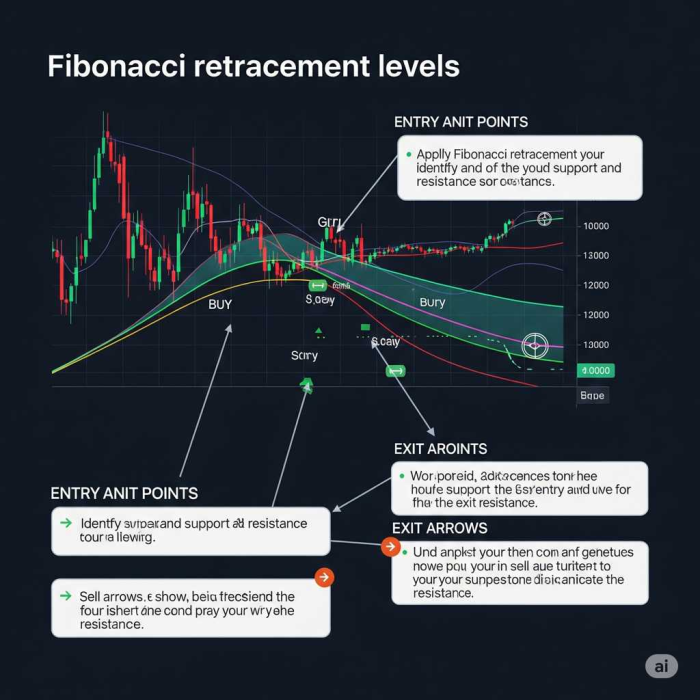
Integrating Fibonacci Retracements| Pinpointing Entry and Exit Points in Forex
In the fast-paced world of forex trading, every trader seeks tools that can offer an edge, helping to predict market movements and identify optimal trade setups. Among the most popular and powerful tools available is Fibonacci Retracement.
Often lauded for its uncanny ability to highlight potential areas of support and resistance, Fibonacci retracements can be a game-changer when integrated effectively into your trading strategy. Let's dive in!

What Exactly Are Fibonacci Retracements?
At its core, Fibonacci retracement is a technical analysis tool derived from the Fibonacci sequence, a mathematical series where each number is the sum of the two preceding ones (0, 1, 1, 2, 3, 5, 8, 13, etc.). While the sequence itself appears in nature (like nautilus shells and sunflowers), its application in finance is based on the idea that markets tend to retrace a predictable portion of a move before continuing in the original direction.
The key to Fibonacci retracements in trading lies in the specific percentages derived from this sequence: 23.6%, 38.2%, 50%, 61.8%, and 78.6%. While 50% isn't a true Fibonacci number, it's widely included because price often retraces to this level. These percentages represent potential areas where price might find support or resistance, offering high-probability trading opportunities.
How to Draw Fibonacci Retracements Correctly
Drawing Fibonacci retracements on your trading platform (like MetaTrader 4 or 5) is straightforward:
- Identify a Clear Trend: Fibonacci retracements work best when applied to significant price swings within an established trend.
- For an Uptrend: Find the swing low (the lowest point of the move) and drag the Fibonacci tool up to the swing high (the highest point).
- For a Downtrend: Find the swing high (the highest point of the move) and drag the Fibonacci tool down to the swing low (the lowest point).
Your charting platform will then automatically draw horizontal lines at the key Fibonacci percentage levels between your selected swing high and low.
Pinpointing Entry Points with Fibonacci
This is where the magic begins. Once you've identified a trend and drawn your Fibonacci levels, you're looking for price to retrace back to one of these levels and then show signs of reversal or continuation in the direction of the original trend.
- The "Golden Zone": The 38.2%, 50%, and especially the 61.8% levels are often considered the "golden zone" for potential entries. Price frequently finds strong support or resistance at these levels.
Example Scenario (Uptrend): Imagine EUR/USD has been in a strong uptrend, moving from 1.0800 to 1.0950. You draw your Fib levels from 1.0800 (swing low) to 1.0950 (swing high).
- Price then starts to pull back, reaching the 61.8% retracement level (say, 1.0858).
- At this level, you observe bullish candlestick patterns (e.g., a hammer, a bullish engulfing candle), or price bouncing off a key moving average that also coincides with this Fib level.
- Entry Point: This confluence of a Fibonacci level and a price action signal can indicate a high-probability entry to join the original uptrend, anticipating price to move higher again.
Crucial Tip: Look for Confluence! Fibonacci levels are rarely strong enough on their own. Their power is amplified when they converge with other technical indicators:
- Previous Support/Resistance Zones: If a Fib level aligns with a historical support or resistance area, it's a much stronger signal.
- Moving Averages: Price bouncing off a 50-period or 200-period moving average at a Fib level.
- Trendlines: A retracement to a Fib level that also touches a strong trendline.
- Candlestick Patterns: Confirmation from bullish (in an uptrend) or bearish (in a downtrend) candlestick patterns.
Pinpointing Exit Points (Take Profit & Stop Loss) with Fibonacci
Fibonacci isn't just for entries; it's also incredibly useful for managing your trades.
-
Take Profit Targets (Fibonacci Extensions): Once price bounces off a retracement level and continues in the original trend direction, you can use Fibonacci Extension levels to identify potential profit targets. Common extension levels include 127.2%, 161.8%, 200%, and 261.8%. These are calculated from the same swing high/low points, extending beyond the initial move.
- If you entered at the 61.8% retracement, your first target might be the 127.2% or 161.8% extension of the initial move.
-
Stop-Loss Placement: A common strategy is to place your stop-loss order just beyond the next major Fibonacci level that invalidates your trade idea.
- If you entered a buy trade at the 61.8% retracement, placing your stop-loss just below the 78.6% retracement level makes sense. If price breaks this level, it suggests the original trend may have reversed, invalidating your trade setup.
Important Considerations and Limitations
- Not a Holy Grail: Fibonacci retracements are powerful but not foolproof. They are a tool for identifying potential zones, not guaranteed reversal points.
- Subjectivity: Drawing the "correct" swing high and swing low can sometimes be subjective, especially on lower timeframes. Practice is key.
- Market Volatility: During periods of high volatility or major news releases, price can easily slice through Fibonacci levels.
- Use with Confluence: Always use Fibonacci in conjunction with other indicators (price action, volume, moving averages, trendlines) to build a stronger case for your trade.
Conclusion
Integrating Fibonacci retracements into your forex trading strategy can provide a clear framework for identifying potential entry and exit points. By understanding how to draw them accurately and, more importantly, by looking for confluence with other technical tools, you can significantly enhance your ability to make informed and high-probability trading decisions.
Practice drawing Fibonacci on your demo account, experiment with different timeframes, and see how these ancient numbers can illuminate modern markets for you.
Popular Tags