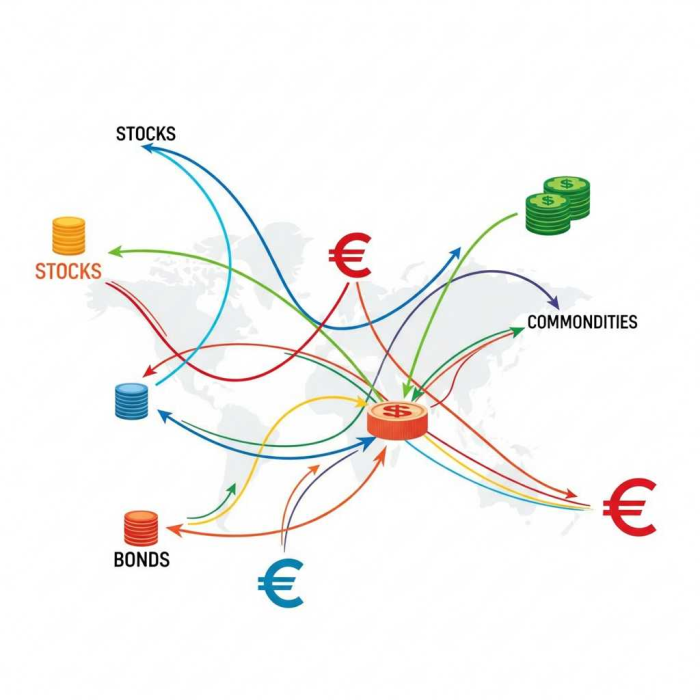
Intermarket Analysis | Unlocking Hidden Insights in the Financial Markets
In the dynamic world of finance, it's easy to get caught up focusing on a single stock, a particular currency pair, or one commodity. We dissect charts, analyze news, and pore over company reports, all within the confines of our chosen market. But what if there's a broader perspective that can significantly enhance our understanding and improve our trading decisions?

Enter Intermarket Analysis.
Pioneered by technical analyst John J. Murphy, intermarket analysis is the study of how different financial markets move in relationship to each other. It's the realization that no market operates in isolation. Stocks, bonds, commodities, and currencies are all interconnected, influenced by common economic forces, and often provide valuable clues about each other's future direction.
Why Does Intermarket Analysis Matter?
Think of it like a symphony. While each instrument plays its own part, it's the harmony and interplay between them that create the overall masterpiece. Similarly, financial markets, while distinct, are constantly interacting, and understanding these interactions can give you a significant edge.
Here's why intermarket analysis is a powerful tool for any trader or investor:
- Holistic Market View: Instead of a narrow focus, intermarket analysis provides a comprehensive understanding of the global financial landscape. You gain a macro-level perspective, allowing you to see the bigger picture.
- Leading Indicators: Often, movements in one market can act as a leading indicator for another. For example, a shift in bond yields might signal an impending change in the stock market, or commodity price fluctuations could foreshadow inflation.
- Confirmation and Divergence: Intermarket analysis can confirm trends you observe in your primary market, or, more importantly, highlight divergences. If your stock chart is screaming "buy" but related markets are flashing warning signs, it prompts you to re-evaluate, potentially saving you from a costly mistake.
- Improved Risk Management: By understanding these relationships, you can better assess overall market sentiment (risk-on vs. risk-off) and adjust your portfolio allocation accordingly, potentially mitigating risk during uncertain times.
- Enhanced Timing: Identifying these intermarket correlations can help you fine-tune your entry and exit points, giving you greater precision in your trades.
Key Intermarket Relationships to Watch
While the possibilities are vast, some core relationships form the bedrock of intermarket analysis:
- Stocks vs. Bonds: These two often compete for investor capital. When optimism reigns and economic growth is expected, investors tend to favor stocks. Conversely, during periods of economic uncertainty or slowing growth, money often flows into the relative safety of bonds. A rising bond market (falling yields) can sometimes precede a rally in stocks, while a falling bond market (rising yields) might signal trouble ahead for equities.
- Bonds vs. Commodities: There's generally an inverse relationship here. Rising commodity prices are often a leading indicator of inflation, which is bearish for bonds (as inflation erodes the value of fixed-income payments). Conversely, falling commodity prices can be bullish for bonds.
- Commodities vs. Currencies (especially the US Dollar): Many commodities are priced in USD. Therefore, a strong US Dollar can make commodities more expensive for buyers using other currencies, potentially putting downward pressure on commodity prices. Conversely, a weak US Dollar can make commodities cheaper and more attractive, often leading to price increases. Commodity-exporting countries often see their currencies strengthen when commodity prices rise.
- Stocks vs. Commodities: This relationship can be nuanced. Generally, during periods of economic expansion, both stocks and commodities might rise as demand for raw materials and corporate earnings increase. However, excessive commodity inflation can squeeze corporate profits and hurt stock valuations.
Putting Intermarket Analysis into Practice
So, how do you incorporate this powerful approach into your own analysis?
- Chart Comparison: Visually comparing charts of different asset classes side-by-side is a great starting point. Look for trends, reversals, and divergences.
- Ratio Charts: Creating ratio charts (e.g., S&P 500 / 10-Year Treasury Bond) can clearly illustrate the relative performance of two markets. An uptrend in the ratio indicates the numerator is outperforming the denominator.
- Correlation Analysis: While not always static, understanding historical correlations between markets can provide valuable insights. Tools and software can help you quantify these relationships.
- Stay Informed on Macroeconomics: Keep an eye on key economic indicators like inflation, interest rates, and GDP growth. These fundamental drivers often explain intermarket movements.
- Combine with Other Analysis: Intermarket analysis is not a standalone solution. It's most effective when combined with your preferred technical and fundamental analysis techniques. It provides context and confirmation, not the sole answer.
The Bottom Line
In today's interconnected global economy, ignoring the relationships between markets is akin to trading with one eye closed. Intermarket analysis provides a wider lens, allowing you to anticipate shifts, confirm trends, and ultimately make more informed and robust trading and investment decisions. It's a journey into understanding the intricate dance of the financial markets, and one that can significantly elevate your analytical prowess.
Popular Tags